
- Home
- /
- Cognitive Neurology
- /
- Understanding the Visual Processing System

Our biological perceptual processing system allows us to experience the world around us through our five senses; sight, sound, taste, smell, and touch. This paper focusses on understanding the visual perceptual processing system by following the path of a light ray into the photoreceptor system of the eye. After exploring the anatomy of the eye, the focus moves towards how the electric pulses from the receptors are transferred into the brain to be detected as signals. It is followed by a discussion on the biological ability of humans to detect contrast and the attributes of the visual stimulus that can increase the level of contrast. Scenarios with multiple stimuli and the need to include multiple visual stimulus dimensions are presented. The paper concludes with the review of the dashboard of a web analytics tool using the research of concepts discussed in this paper.
Visible Light And its Journey into the Eye
Sunlight consists of photons arranged in a spectrum of electromagnetic radiations. The Human eye can respond to wavelengths from about 380 to 740 nanometers and this range of the spectrum is called Visible Light (Starr, Evers, & Starr, 2006). The direction of a ray of light may vary depending on its interaction with objects in the environment. The light ray may get absorbed, reflected, refracted or diffracted and this complex interaction can be simplified with the concept of Ambient Optical Array, an array of light rays that arrives at a stationary point in the environment (Gibson, 1979).
This light ray, which acts as a visual stimulus, enters the eye through a clear membrane called the cornea. A sphincter muscle, Iris, controls the light entering into the lens of the eye where the image is inverted and projected on the retina, the back surface of the eye. Embedded in the retina are photoreceptors and their neural support. The Photoreceptors contain light-sensitive molecules that become unstable and split apart, altering electric current around them and triggering a neural signal when exposed to light. The two types of photoreceptors are Rods which are sensitive at low light levels, and Cones which are sensitive at normal light levels (Gazzaniga, Ivry, & Mangun, 2009). These photoreceptors are connected to Bipolar cells through either excitatory or inhibitory synapses. The Bipolar cells are connected to Retinal Ganglion Cells (RGC) which are neurons that collect signals from a concentric receptive field and transmit them to the visual cortex of the brain through the Lateral Geniculate Nucleus (LGN) (Haber & Hershenson, 1973; Lindsay & Norman, 2013). Similar to RGC, cells in the LGN have a concentric receptive field that increases the neuronal activity from its steady state when a spot of light falls inside the central excitatory region. However, the neuronal activity is inhibited from its steady state when the spot of light is moved outside the excitatory region. A visual stimulant that falls on the center and outside the excitatory region does not have any effect in the neuronal activity as the excitation and the inhibition cancel each other (Hubel & Wiesel, 1977). Furthermore, the neuronal activity returns to the steady state if the visual stimulus persists is in the same receptive area. Thus, the receptor system responds to relative change or contrast in the visual stimulus (Haber & Hershenson, 1973).
Detecting a Signal in the Brain
This change in neuronal activity is processed to identify signals in the visual cortex of our brain and can be understood through Signal Detection Theory (SDT). SDT is applicable when there are two discrete states: signal and noise. In the first stage of processing, sensory evidence (neuronal activity) related to the presence or absence of a signal is gathered. In the second stage, the validity of the evidence from a signal is confirmed. If the evidence exceeds the critical threshold, the presence of the signal is confirmed, if not the presence is declined (Macmillan, Creelman, & Creelman, 2004). The neuronal activity level varies continuously even if the signal is absent because of two types of noise: stimulus noise, observed because of the unique internal psychological representation formed each time the stimulus is presented, and memory noise, observed due to variation in categorical boundaries of the recognition process (Nosofsky, 1983). The distinction between signal and noise may not be distinct in real life conditions and Fuzzy SDT is used in such cases. Fuzzy SDT allows the neuronal activity to belong to more than one set and maps the membership of the activity to a set using a mapping function (Parasuraman, Masalonis, & Hancock, 2000). The fuzzy nature of the neuronal signal depends on the information captured by the visual receptor system and its attributes.
Receptor System and its Ability to Detect Signals Through Contrast
Binocular viewing improves visual acuity and the brain is able to perfectly sum the receptor information from both the eyes (Blake & Fox, 1973). The visual receptor system has 3 types of cones divided by wavelength sensitivity: short, medium and long. The input from these cones is processed into three distinct channels: the luminance (black–white) channel, the red-green channel, and the yellow-blue channel (Hurvich & Jameson, 1957). Luminance is the measurable intensity of light emanated from a surface per unit area in a given direction. The luminance channel is capable of carrying a lot more amount of detail than that carried by the chromatic channels (Mullen, 1985). A visual stimulus with a high luminance contrast induces more neuronal activity in the visual cortex than that with low contrast (Pooresmaeili, Poort, Thiele, & Roelfsema, 2010). The shape and form of the stimuli are processed mainly through the luminance channel (Gregory, 1977). Furthermore, it is observed that perceptual closure, a grouping of disjointed contours, occurs in the early stages of the visual system when the disconnected contour and the background have a contrast polarity, conditions with maximum contrast (Davis & Driver, 1994).
Attributes to Regulate the Strength of a Signal
Brightness is an attribute of the visual stimulus that refers to the perceived amount of light radiating from a source. The brightness of a visual stimulus is enhanced when the luminance of the surrounding area is lesser than that of the stimulus and this relation is inverted when the luminance of the surrounding is greater than or equal to that of the visual stimulus (Heinemann, 1955). The lightness of a surface is another attribute and it is the perceived amount of light reflecting off the surface. Two surfaces with different luminance form a sharp edge and the human eye will perceive an edge enhancement depending on the surface that is being focused by the fovea due to the inhibitory synapses network of receptors (Haber & Hershenson, 1973). Furthermore, pseudo edges are created when two areas with equal lightness have an edge that shades off gradually between them and this is called the “Cornsweet Effect” (Cornsweet, 2012).
Saturation is an attribute that denotes to the purity of a color. A color with high saturation is gaudy and a color with low saturation is closer to black, white or gray (Judd, 1952). Hue is an attribute that indicates the spectral composition of a color (Haber & Hershenson, 1973). Strong illusory depth effects are found when unique wavelengths of light are focused at different parts of the eye because the human eye is not calibrated for “Chromatic Aberration” (Jackson, MacDonald, & Freeman, 1994). Furthermore, the contrast between two colors can be theoretically achieved more accurately due to the activity in the color opponent channel (Ware & Cowan, 1982). To add to this, if the two colors involved in the contrast also have a luminance difference, the human eyes will perceive a stereoscopic depth in the pattern (Lu, 1972).
Detecting Signals Along Multiple Dimensions
Humans can detect a stimulus if the strength of the signal along the continuum of sensory evidence is high. However, the detection performance is comparatively poor when humans have to classify three or more stimuli at different levels along the same continuum, a task called absolute judgment, even though there may be a considerable physical difference between levels. Furthermore, for such tasks, humans must identify the level of a stimulus along the sensory continuum with respect to a dimension. Errors are seen when the number of stimuli increases, suggesting that humans have a maximum channel capacity (Miller, 1956). “Perceptual effects” are seen when the observer partitions the sensory continuum to identifiable regions along a dimension (Thurstone, 1927). On the other hand, demonstrations have proved that having multidimensional stimuli increases the information available in the sensory continuum for absolute judgement (Egeth & Pachella, 1969). Texture can be used as a dimension to perform an early segmentation on the visual stimuli and also ease the discrimination process (Werner & Chalupa, 2004). Human preference in the orientation of the visual stimulus can be another dimension to be taken into consideration (Appelle, 1972).
Thus, the human visual perceptual processing system has evolved to identify the relative change in a visual stimulus using multiple attributes. The higher the contrast the higher the intensity of the signal and this can be achieved by regulating the attributes of the visual stimulus. Cues along multiple dimensions are used to discriminate signals in cases where there are multiple stimuli in the environment.
Product Review
Google analytics is a free web analytics service offered by Google as a part of its Marketing Platform. It helps users analyze visitor traffic to a website through a web application and also a mobile application (“Google Analytics,” 2019). The web application of Google analytics is the target of this product review. The users of this tool vary from professionals like marketing managers and business analysts to individuals who have an active website deployed on the internet. A typical task done by the users of this tool is to monitor the website traffic and compare it to that of a previous time period. Professional users use this tool to analyze the data of visitors of a website and their browsing behavior by identifying some critical information like location, the medium of acquisition, time of peak traffic, and devices used. This data will then be used to increase the performance of the website and its campaigns.
Context of use
An elderly gentleman, Ross is using Google analytics to drive traffic to his blog. He is a dichromat and cannot distinguish between red and green (Gazzaniga et al., 2009). Moreover, the defects in Ross’s eye due to his age makes him less sensitive to subtle shades of blue (Haegerstrom-Portnoy, Schneck, & Brabyn, 1999).

Positive. Ross starts his journey from the dashboard as shown in Figure 1. The large blue colored rectangle in the center of the screen has the highest signal strength due to its size and its luminosity contrast with its background. Moreover, the high saturation of the blue makes the hue more vivid and visible. The choice of color used, blue is not in the red-green channel and is appropriate for taking Ross’s vision impairment into account.
Negative. However, the high saturation of blue makes it difficult to identify the details present inside the rectangle because of the low luminosity contrast between the details in white and the background in bright blue. Furthermore, Ross will be irritated looking at a screen that has a large area filled with a vivid, highly saturated color. The background color of the card can be changed to a blue with low luminosity and saturation. The foreground color of the card used for details can have high luminosity contrast with the background.
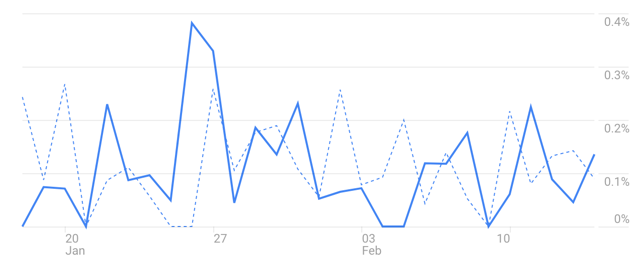
Positive. The line graph in the dashboard as shown in figure 2 has three components: the primary solid line, the secondary dotted line and the axis. The primary line has a highly saturated hue of blue ensuring sufficient luminosity contrast with the background. The high saturation of blue compensates for the narrow width of the line and makes it a strong signal. The secondary line has a lower saturation of blue when compared than that of the primary line and the change in texture between Solid line (Primary) to Dotted line (Secondary) makes it clearer to distinguish between them. The axis lines have the lowest luminosity contrast compared to the other two lines, but it is still noticeable.

Positive. Ross will not be able to distinguish between the green number, and the red number because of his visual impairment. These numbers are supplemented by symbols that have a high luminosity contrast compared to the background. This would enable Ross with enough information to distinguish between the two signals.
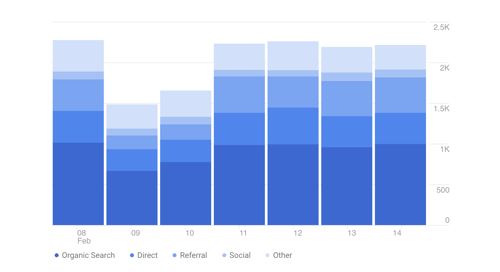
Negative. The stacked column graph as shown in Figure 4 has multiple layers of signals. These signals have a subtle variation in luminosity and saturation. The degradation of Ross’s eye due to his age may not be suited to quickly distinguish this subtle variation, especially the first 3 variations of the color. Hence reinforcing those signals using another attribute like color or dimension like texture will help Ross in distinguishing the layers and their signals. Another approach to solving this problem is to include a line with high luminous contrast between the layers.

Negative. A selected page in the left navigation bar as shown in the first half of Figure 5 is represented using a rounded rectangle in blue with low saturation and a symbol (icon) with high saturation. The luminosity contrast between the rounded blue rectangle and the symbol is high. However, the background of the page and the blue rounded rectangle look isoluminous. The lower half of Figure 5 shows the visual effect when Ross hovers his mouse on any item that is not selected. Taking into account that Ross is less sensitive to blue, both of the aforementioned states look the same to him. Consider reinforcing one of the signals with a new attribute or a dimension to strengthen the signal.

Positive. The backgrounds of the header and the body of the page are isolimnous as shown in Figure 6. However, a thin line with a high luminosity contrast separates both of the layers. This line is clearly visible, and Ross can identify the header from the body.

Positive. Ross can clearly discriminate the signals of the background of a card from that of the page as shown in Figure 7. This is because the card appears to be at a higher level from the background due to luminance change and also because of the edge that gradually shades off to the background, the Cornsweet effect.
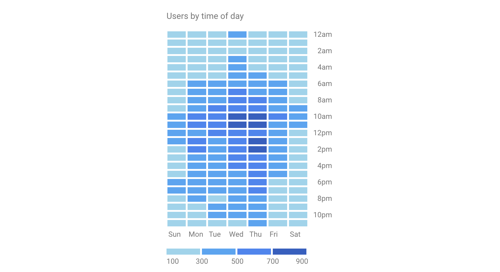
Negative. The color scale used in the matrix chart differs only in luminosity and saturation. Due to the small size of the cells in the matrix, differences in just two attributes is not very significant to distinguish between signals, especially for Ross. Thus, changing the attributes along another attribute or dimension can be thought of to improve distinguishability.
The dashboard of Google analytics looks well designed. However, subtle tweaks can make sure all the signals from the dashboard are distinguishable.
References
Anstis, S., & Cavanagh, P. (1983). A minimum motion technique for judging equiluminance. York University.
Appelle, S. (1972). Perception and discrimination as a function of stimulus orientation: The “oblique effect” in man and animals. Psychological Bulletin, 78(4), 266–278. https://doi.org/10.1037/h0033117
Blake, R., & Fox, R. (1973). The psychophysical inquiry into binocular summation. Perception & Psychophysics, 14(1), 161–185. https://doi.org/10.3758/BF03198631
Cornsweet, T. (2012). Visual Perception. Academic Press.
Davis, G., & Driver, J. (1994). Parallel detection of Kanizsa subjective figures in the human visual system. Nature; London, 371(6500), 791–793.
Egeth, H., & Pachella, R. (1969). Multidimensional stimulus identification. Perception & Psychophysics, 5(6), 341–346. https://doi.org/10.3758/BF03210654
Gazzaniga, M., Ivry, R., & Mangun, G. (2009). Cognitive Neuroscience: The Biology of the Mind, Second Edition.
Gibson, J. J. (1979). The Ecological Approach to Visual Perception, 347.
Google Analytics. (2019). In Wikipedia. Retrieved from https://en.wikipedia.org/w/index.php?title=Google_Analytics&oldid=883787469
Gregory, R. L. (1977). Vision with Isoluminant Colour Contrast: 1. A Projection Technique and Observations. Perception, 6(1), 113–119. https://doi.org/10.1068/p060113
Haber, R. N., & Hershenson, M. (1973). The psychology of visual perception. Oxford, England: Holt, Rinehart & Winston.
Haegerstrom-Portnoy, G., Schneck, M. E., & Brabyn, J. A. (1999). Seeing into Old Age: Vision Function Beyond Acuity: Optometry and Vision Science, 76(3), 141–158. https://doi.org/10.1097/00006324-199903000-00014
Heinemann, E. G. (1955). Simultaneous brightness induction as a function of inducing- and test-field luminances. Journal of Experimental Psychology, 50(2), 89–96. https://doi.org/10.1037/h0040919
Hubel, D. H., & Wiesel, T. N. (1977). Ferrier Lecture: Functional Architecture of Macaque Monkey Visual Cortex. Proceedings of the Royal Society of London. Series B, Biological Sciences, 198(1130), 1–59.
Hurvich, L. M., & Jameson, D. (1957). An opponent-process theory of color vision. Psychological Review, 64(6, Pt.1), 384–404. https://doi.org/10.1037/h0041403
Jackson, R., MacDonald, L. W., & Freeman, K. (1994). Computer generated colour: a practical guide to presentation and display. Wiley New York.
Judd, D. B. (1952). Color in business, science and industry. Oxford, England: Wiley.
Lindsay, P. H., & Norman, D. A. (2013). Human Information Processing: An Introduction to Psychology. Academic Press.
Lu, C. (1972). The interaction of color and luminance in stereoscopic vision (phd). California Institute of Technology. Retrieved from http://resolver.caltech.edu/CaltechTHESIS:05022016-163223190
Macmillan, N. A., Creelman, C. D., & Creelman, C. D. (2004). Detection Theory : A User’s Guide. Psychology Press. https://doi.org/10.4324/9781410611147
Miller, G. A. (1956). The magical number seven, plus or minus two: some limits on our capacity for processing information. Psychological Review, 63(2), 81–97. https://doi.org/10.1037/h0043158
Mullen, K. T. (1985). The contrast sensitivity of human colour vision to red-green and blue-yellow chromatic gratings. The Journal of Physiology, 359(1), 381–400. https://doi.org/10.1113/jphysiol.1985.sp015591
Nosofsky, R. M. (1983). Information integration and the identification of stimulus noise and criterial noise in absolute judgment. Journal of Experimental Psychology: Human Perception and Performance, 9(2), 299–309. https://doi.org/10.1037/0096-1523.9.2.299
Parasuraman, R., Masalonis, A. J., & Hancock, P. A. (2000). Fuzzy signal detection theory: Basic postulates and formulas for analyzing human and machine performance. Human Factors; Santa Monica, 42(4), 636.
Pooresmaeili, A., Poort, J., Thiele, A., & Roelfsema, P. R. (2010). Separable Codes for Attention and Luminance Contrast in the Primary Visual Cortex. Journal of Neuroscience, 30(38), 12701–12711. https://doi.org/10.1523/JNEUROSCI.1388-10.2010
Starr, C., Evers, C. A., & Starr, L. (2006). Biology: Concepts and Applications. Thomson, Brooks/Cole.
Thurstone, L. L. (1927). A law of comparative judgment. Psychological Review, 34(4), 273–286. https://doi.org/10.1037/h0070288
Ware, C., & Cowan, W. B. (1982). Changes in perceived color due to chromatic interactions. Vision Research, 22(11), 1353–1362. https://doi.org/10.1016/0042-6989(82)90225-5
Werner, J. S., & Chalupa, L. M. (2004). The Visual Neurosciences. MIT Press.